"> "> diabetes monitoring Archives - Living Diabetes

Heart Rate Variability and Blood Sugar: What Your HRV Is Telling You About Your Diabetes

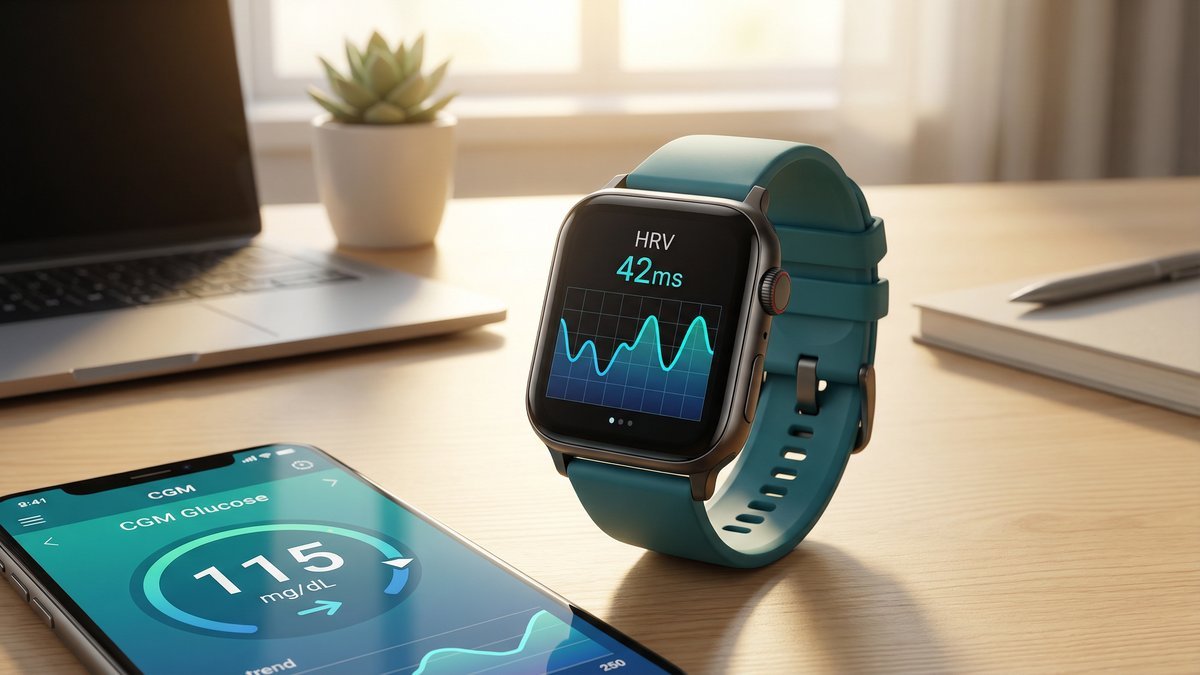
Heart rate variability — the variation in time between consecutive heartbeats — has emerged as one of the most informative biomarkers in modern medicine. For people with diabetes, HRV is particularly significant: it reflects the health of the autonomic nervous system, predicts cardiovascular risk, and responds measurably to blood sugar changes. With wearable technology now making HRV accessible to everyone, understanding what it means has never been more important.

What Is Heart Rate Variability?

Despite what the name might suggest, a healthy heart does not beat with metronomic regularity. The interval between beats varies constantly — influenced by breathing, physical activity, stress, and the balance between the sympathetic (fight-or-flight) and parasympathetic (rest-and-digest) branches of the autonomic nervous system. This variability is HRV, and higher variability generally reflects a healthier, more adaptable autonomic nervous system.

Low HRV indicates that the autonomic nervous system is under stress or has reduced adaptability — a state associated with cardiovascular disease, inflammation, poor recovery from exercise, and in the context of diabetes, cardiac autonomic neuropathy (CAN).

HRV and Diabetes: The Cardiac Autonomic Neuropathy Connection

Cardiac autonomic neuropathy is a serious but underdiagnosed complication of diabetes, affecting approximately 20% of people with type 1 diabetes and up to 30% of people with type 2 diabetes. It results from damage to the autonomic nerve fibres that regulate heart rate and vascular tone, caused by chronic hyperglycaemia and oxidative stress.

CAN manifests as reduced HRV, resting tachycardia, orthostatic hypotension (dizziness on standing), and exercise intolerance. In its advanced stages, it is associated with a 3–5 fold increase in cardiovascular mortality and is a recognised cause of sudden cardiac death in diabetes.

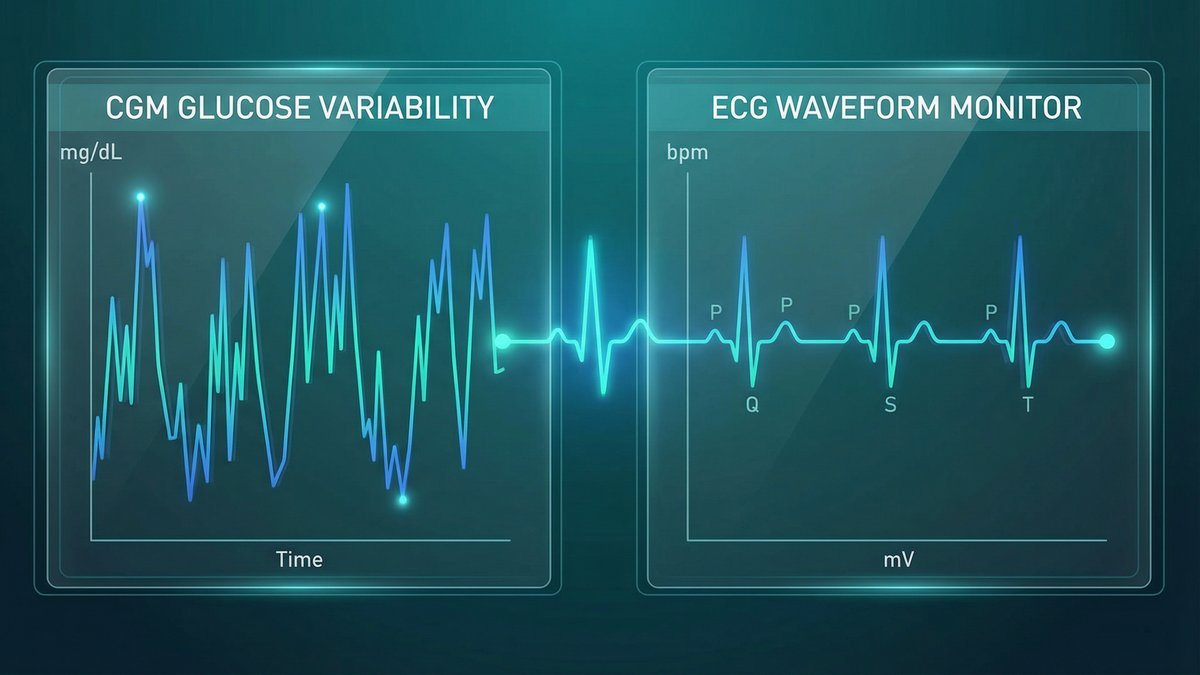
How Blood Sugar Affects HRV in Real Time

Research using simultaneous CGM and HRV monitoring has revealed a direct, real-time relationship between glucose levels and autonomic function. Both hyperglycaemia (high blood sugar) and hypoglycaemia (low blood sugar) acutely reduce HRV. Post-meal glucose spikes trigger sympathetic nervous system activation, reducing parasympathetic tone and lowering HRV. Nocturnal hypoglycaemia causes profound HRV suppression and is associated with cardiac arrhythmias during sleep.

How to Improve Your HRV with Diabetes

✅ Evidence-Based Strategies to Improve HRV
  • Optimise blood sugar control — reducing glucose variability is the most direct way to improve HRV in diabetes
  • Regular aerobic exercise — 150 minutes per week of moderate-intensity exercise significantly improves HRV
  • Diaphragmatic breathing — slow, deep breathing at 6 breaths/minute acutely increases HRV
  • Sleep quality — HRV is predominantly restored during deep sleep; prioritise 7–9 hours
  • Stress management — chronic psychological stress is a major driver of low HRV
  • Avoid alcohol — even moderate alcohol consumption suppresses HRV for 24–48 hours
💡 Key Takeaway

HRV is a window into your autonomic nervous system health — and in diabetes, it is a sensitive early marker of cardiac autonomic neuropathy and cardiovascular risk. If your wearable device shows consistently low HRV, discuss it with your diabetes team. Improving blood sugar control, exercising regularly, sleeping well, and managing stress are all proven ways to improve HRV and protect your heart.


Related articles

CGM Patterns That Predict Cardiovascular Risk: What Your Glucose Data Is Telling You

Your continuous glucose monitor does far more than track your blood sugar in real time. The patterns it reveals — the peaks, troughs, and variability between readings — are increasingly recognised as powerful predictors of cardiovascular risk. Understanding what your CGM data is telling you about your heart health could be one of the most important things you do this year.

Beyond HbA1c: Why Glucose Variability Matters

For decades, HbA1c was the primary metric used to assess long-term diabetes management. But HbA1c is an average — it tells you nothing about the peaks and troughs that occur throughout the day. Two people can have identical HbA1c values yet have very different glucose profiles, and very different cardiovascular risk.

Research has consistently shown that glucose variability — the degree to which blood sugar fluctuates throughout the day — is an independent predictor of cardiovascular events, even after controlling for average glucose levels. CGM technology has made it possible to measure this variability with unprecedented precision.

Key CGM Metrics and Their Cardiovascular Significance

CGM MetricWhat It MeasuresCardiovascular Link
Time in Range (TIR)% of time glucose 3.9–10.0 mmol/LEach 10% increase in TIR associated with reduced CVD risk markers
CV% (Coefficient of Variation)Measure of glucose variabilityCV% >36% independently predicts cardiovascular events
Time Above Range (TAR)% of time glucose >10.0 mmol/LLinked to endothelial dysfunction and oxidative stress
Time Below Range (TBR)% of time glucose <3.9 mmol/LHypoglycaemia triggers adrenaline surge, increasing cardiac arrhythmia risk
Mean Amplitude of Glycaemic Excursions (MAGE)Magnitude of glucose swingsHigh MAGE associated with increased carotid intima-media thickness

Post-Meal Spikes: The Hidden Cardiovascular Danger

Post-prandial glucose spikes — the sharp rise in blood sugar after eating — are particularly damaging to the cardiovascular system. Each spike triggers a cascade of harmful effects: oxidative stress (free radical production), endothelial dysfunction (damage to the inner lining of blood vessels), and pro-inflammatory cytokine release. Over time, these repeated insults accelerate atherosclerosis.

⚠️ Warning Sign

If your CGM regularly shows glucose spikes above 10 mmol/L after meals, this is not just a blood sugar problem — it is a cardiovascular risk factor that warrants urgent attention and discussion with your diabetes team.

Nocturnal Hypoglycaemia: A Silent Cardiac Threat

One of the most valuable capabilities of CGM is detecting nocturnal hypoglycaemia — low blood sugar episodes during sleep that would otherwise go unnoticed. These episodes are not merely uncomfortable; they trigger a powerful sympathoadrenal response (adrenaline release) that can cause cardiac arrhythmias, including QT prolongation and ventricular tachycardia. In people with pre-existing cardiovascular disease, nocturnal hypoglycaemia is a recognised cause of sudden cardiac death.

How to Use Your CGM Data to Protect Your Heart

Maximising your CGM’s cardiovascular protective potential requires moving beyond simply watching the number on the screen. Review your ambulatory glucose profile (AGP) report regularly — most CGM apps generate this automatically. Look for patterns of high variability, frequent post-meal spikes, and any nocturnal lows. Share these reports with your diabetes team at every appointment.

✅ Target CGM Metrics for Cardiovascular Protection
  • Time in Range (3.9–10.0 mmol/L): >70%
  • Time Above Range (>10.0 mmol/L): <25%
  • Time Below Range (<3.9 mmol/L): <4%
  • Coefficient of Variation (CV%): <36%
💡 Key Takeaway

Your CGM is a window into your cardiovascular health, not just your blood sugar. High glucose variability, frequent post-meal spikes, and nocturnal hypoglycaemia are all independent cardiovascular risk factors. Use your AGP report, aim for Time in Range above 70%, and discuss your CGM patterns with your diabetes team at every appointment.


Related articles